Skip to main content
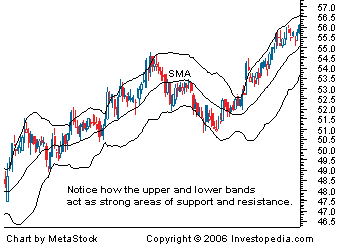
A.) A Bollinger Band® is a band plotted two standard deviations away from a simple moving average, developed by famous technical trader John Bollinger. In this example of Bollinger Bands®, the price of the stock is banded by an upper and lower band along with a 21-day simple moving average.
B.) Traders keep a close eye on volatility because a sudden increase in volatility levels is often the prelude to a market trend reversal. Bollinger Bands are placed over a price chart and consist of a moving average together with upper and lower bands that define pricing "channels".
Learn how you can use indicators https://www.youtube.com/watch?v=J067YeJeESs from our video tutorials.
A Bollinger Band®, developed by famous technical trader John Bollinger, is plotted two standard deviations away from a simple moving average.

Comments
Post a Comment